The State of Fashion: 100+ Fashion Industry Statistics (2021)
As globalization and digital innovation shift consumer spending habits and fashion as we know it, the wave of change within the industry is on the rise. 54% of Social Browsers use social media to research products which goes to show how integral technology is in the purchasing journey. However, e-commerce is not the only medium we are seeing evolve. From the rise in sustainability to an emphasis on community engagement, this article takes a deep dive into fashion industry statistics and how they are propelling executives to disrupt and challenge the norm.
Clothing plays a role in every aspect of our lives whether it be professionally or personally. From choosing fabrics to ordering products, we all use clothing to tell a story and share our brand. Whether you’re working in the fashion industry or not, understanding new and emerging trends and data will set you apart within the saturated market. To explore how strategic trends, marketing efforts, employment rates and other industry data are shaping fashion retailers in 2021 and beyond, let’s explore statistics that reflect the forces at work in fashion. If you’re interested in learning about a specific topic, jump to any industry section using our table of contents below.
- E-Commerce Retail
- Going Global
- Consumer Spending Habits
- Trends & Forecasting
- Social Media & Marketing
- Employment in Fashion
- Footwear & Accessories
- Jewelry & Luxury
- Sustainability
E-Commerce Fashion Industry Statistics

As mobile-friendly and smartphone technology has advanced the online shopping experience, e-commerce fashion industry statistics reveal that retailers are optimizing sites for the mobile user. 85% of Americans now own a smartphone, increasing time spent online and raising expectations for a fast and seamless shopping experience. Explore the e-commerce fashion industry statistics that are shaping changes in automation and buyer behaviors below.
- By 2022, it is projected that e-commerce transactions will be responsible for 36% of total fashion retail sales (Forrester).
- In 2019, online fashion sales accounted for 28.24% of total retail e-commerce sales in the United States (Statista).
- Dedicated fan apps can increase yearly revenue by 5%, with ‘chosen’ customers not only “serving as brand ambassadors”, but also spending up to twice as much (Riskified).
- In 2019, U.S. online retail sales of physical goods amounted to 365.2 billion US dollars and are projected to reach close to 600 billion US dollars in 2024 (Statista).
- By 2021, 17% of the Accessories market’s revenue will be acquired through online commerce (Statista).
- By 2025, the market value of Fashion e-commerce is expected to reach over $1.1 trillion USD (Statista).
- Approximately 73% of e-commerce transactions are expected to be made using a mobile device by the end of 2021 (Statista)
- 81% of North American consumers are likely to continue buying from a brand because of the loyalty program incentives (Brand Loyalty).
- It is projected that the Indian e-commerce market will grow from 2020’s $46.2 billion USD to $111.40 billion USD by 2025. (India Brand Equity Foundation).
- In 2018, fashion e-commerce accounted for roughly 20.4 percent of the total fashion retail sales in the United States and has continued to experience a steady annual growth rate since 2003 (Statista).
- In 2018, U.S. retail e-commerce revenue from the sale of fashion apparel, footwear and accessories amounted to an estimated 102 billion U.S. dollars and is projected to grow to almost 146 billion U.S. dollars by 2023 (Statista).
- In 2020 alone, e-commerce fashion grew by nearly 27% (Statista).
- A superior digital presence can also improve physical store sales, which is evidenced by the 67% of online shoppers who, when returning an item in person, will browse or make another purchase (Big Commerce).
- Fashion e-commerce was responsible for nearly 30% of U.S. fashion retail sales in 2020 (Statista).
- Over 900 million people have global social media connections, allowing huge ecosystems like Facebook and WeChat to significantly contribute to the efficiency of international markets (The Business of Fashion and McKinsey & Company).
- In 2018, apparel, footwear, and accessories had the highest share of cross-border digital buyers globally, with 68% having purchased from an international seller (eMarketer).
Global Fashion Industry Statistics
It’s no surprise that countries like China, Russia and the United States are dominant players in the lucrative $2.5 trillion global fashion industry, however, many regions are emerging every day in the market. Continue reading for the fashion industry’s growth rate and other global fashion industry statistics that will set a tone for international competition.
- By the end of 2021, China is expected to generate the most revenue in the fashion segment of any other country at nearly $383 billion (Statista).
- China leads as the largest fashion market in the world with an official growth forecast of 6 percent to 6.5 percent for 2019 (The Business of Fashion and McKinsey & Company).
- The Indian clothing market will be worth $53.7 billion in 2020, making it the sixth-largest globally (The Business of Fashion and McKinsey & Company).
- Indonesia is due to be the largest modest fashion market in the world (The Business of Fashion and McKinsey & Company).
- Presently, China has the greatest number of internet users in the world, totaling over 854 million users (Statista).
- 2018 showed a shift in the tide of regional apparel and footwear sales, with over half of these sales occurring outside of European and North American markets for the first time due to an uptick in sales in Asia-Pacific and Latin American markets (The Business of Fashion and McKinsey & Company).
- Asia is now home to over two-thirds of the world’s e-commerce unicorns (The Business of Fashion and McKinsey & Company).
- About 38% of global apparel and footwear sales are attributable to the Asia-Pacific region, making it the largest seller of these goods in the world (The Business of Fashion and McKinsey & Company).
- The quantity of Europe’s off-price stores doubled between 2003 and 2017 (The Business of Fashion and McKinsey & Company).
- In Western Europe, mobile transactions are expected to reach about €148 billion by the end of 2021 due to an annual growth rate of about 23% from 2017-2021 (The Business of Fashion and McKinsey & Company).
- East Asian countries such as Japan and South Korea spend more on research & development as a percentage of GDP than many Western European countries, reflecting the entrepreneurial spirit that is taking root across the culture (The Business of Fashion and McKinsey & Company).
- Russia’s apparel market is expected to value $40.6 billion USD in 2022. (Statista)
- By 2021, it is projected that the Apparel segment’s average revenue per user will reach over $186 USD. (Statista)
- The global women's apparel market growth rate will increase by 50% over the next 12 years (McKinsey & Company).
- In 2020, the Asia Pacific region had a 38% share of the global apparel demand, also boasting the highest growth between 2015 and 2020 at 4 percent (Statista).
- Internet penetration in the UAE and Saudi Arabia is at 99 and 89% respectively, compared to just 57% in China (Hootsuite & We Are Social).
Consumer Spending Statistics

Clothing trends and considerations like shopping local, convenience and brand loyalty are paving the way for the retail industry. From moving stores outside of busy cities to prioritizing localization, fostering an in-store experience is on the rise. Keep reading for other consumer spending statistics that are changing the way executives think about online and in-store sales.
- In May 2021, U.S. clothing retail sales reached $17.3 billion USD, a $1.3 billion increase from the month prior, suggesting a recovery from drastically low pandemic sales levels (Statista).
- June 2021 saw a nearly 63% increase in U.S. apparel sales compared to June 2020 (Statista)..
- 85% of shoppers engage with both online and offline touchpoints, compared with 80% in 2017 (McKinsey & Company).
- 85% of consumers cited convenience as the main reason to shop locally (Facebook).
- In the fashion category, more than 70 percent of purchases are still made offline (Forrester).
- Local shops also make returns much easier for consumers and from a retailer’s perspective, the return rate for apparel is much lower for clothes bought in-store than for those bought online (16% versus 25% respectively) (McKinsey & Company).
- Consumer preference for local shopping is leading retailers to rethink their store network and to open in areas outside the traditional commercial centers (The Business of Fashion and McKinsey & Company).
- Customers’ growing desire for convenience and to shop close to home means that in 2020, many fashion retailers will move into the consumer's neighborhood as a core pillar of their omnichannel strategy (The Business of Fashion and McKinsey & Company).
- 2020-2021 saw the number of customers who make online apparel purchases grow by 19% (McKinsey).
- The global Women's Apparel segment accumulated a revenue of $771 billion USD in 2020 – a decline from previous years as a result of the pandemic – but it is projected to see a rise to $1,098 billion USD by 2026 (Statista).
Fashion Industry Trends & Forecasting
What factors are shaping the future of fashion? Whether pivotal strategies be dictated by digital innovation, buyer expectations or retail locationing, we’ve pulled the top fashion industry trends and forecasting statistics to shed light on what’s next for fashion.
- Germany’s apparel market is projected to continue to hold the highest value in Europe in 2022 at $62.7 billion USD, though its lead over the UK continues to gradually slim (Statista).
- In Europe and the US, more than 65 percent of consumers expect to decrease their spending on apparel, while only 40 percent expect to decrease total household spending (The Business of Fashion and McKinsey & Company).
- The total number of internet users in the Asia Pacific region is expected to rise to about 2.7 billion by 2025, meaning over three fifths of the population will be online (GSMA).
- China was the largest online fashion market in 2018 (volume of $246.9 billion) and it’s expected to reach a volume three times as large as the US by 2023 (Statista).
- As of March 2020, 60% of consumers in the US already reported that they need to be careful how they spend their money, with more than one-third stating that the pandemic is even impacting their ability to make financial ends meet (The Business of Fashion and McKinsey & Company).
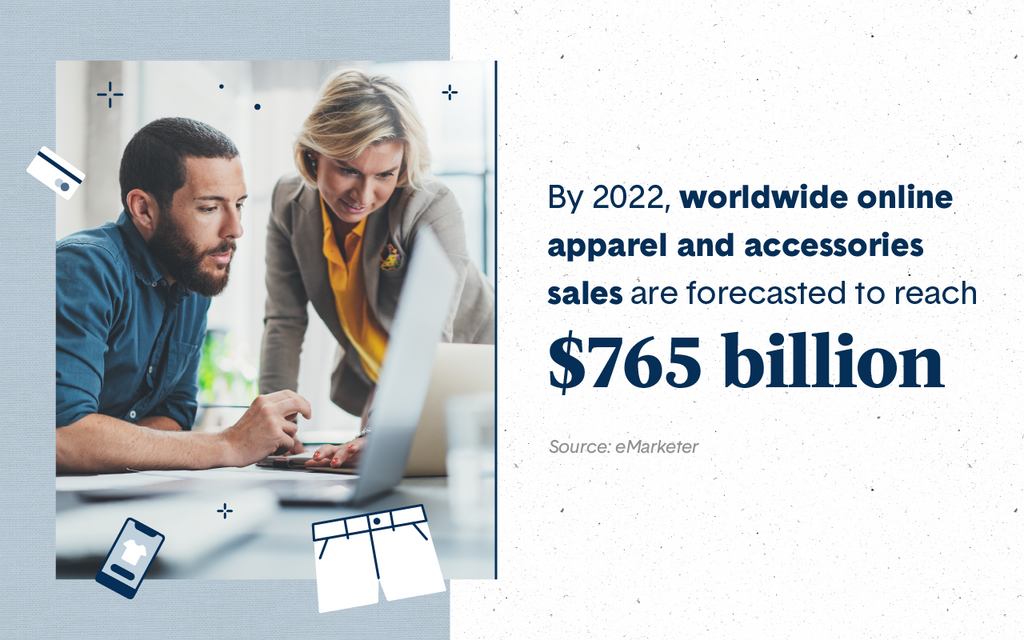
- By 2022, worldwide online apparel and accessories sales are forecast to reach $765 billion (eMarketer).
- McKinsey and Oxford Economics analysis shows that, even in the most positive economic recovery scenario, GDP will only return to pre-crisis levels by the end of 2020 or even the beginning of 2021 (McKinsey & Company).
- Evidence from previous crisis shows that it may take up to two years to fully restore consumer confidence (McKinsey & Company).
- Due to the pandemic in Italy, the number of items on discount is up 20% year-on-year from March 2019 to March 2020 (Edited).
- Low- and middle-income consumers spearheaded the return-to-spending following the peak of the pandemic up until the end of spring of 2021, but recent data shows greater spending from higher-income consumers (McKinsey & Company).
Marketing in Fashion Statistics
Marketing can make or break the success of a brand’s campaign or product launch. Check out the top marketing in fashion statistics to see what strategies are propelling brands in 2021 and beyond.
- The growth rate of the Apparel industry peaked in 2020, reaching 6.2 percent (Statista).
- Stories are now growing 15x faster than feed-based sharing (Block Party).
- 4 out of 5 major brands are already using the Stories format (Block Party).
- Marketers are increasing social ad budgets (up 32 percent in 2018 alone) and producing more ads than ever before (CMO Survey).
- One of every four Facebook Pages now uses paid media (Hootsuite).
- Facebook already accounts for 23% of total U.S. digital ad spending (eMarketer).
- In 2019, 17% of brands have either implemented shoppable galleries or planned to do so in the following year (Hootsuite)
- 70% of China's Gen Z'ers now buy directly from social media (WARC).
- Among U.S. survey respondents who message businesses, 69% say that directly messaging a company helps them feel more confident about the brand (Facebook).
- Social media use is expanding at around 25 percent annually, with nearly 70 percent of users active on Instagram (The Business of Fashion and McKinsey & Company).
- While 86% of businesses utilize influencer marketing, the engagement rate for Instagram influencer sponsored posts fell from 4 percent in 2016 to 2.4 percent in 2019 (The Business of Fashion and McKinsey & Company).
- Fashion companies are shifting their marketing and production strategies to embrace sustainability, with over two fifths of fashion brands showing supplier transparency in 2017 (The Business of Fashion and McKinsey & Company).
- In 2018, fashion executives listed investing in digital marketing capabilities as a top priority (The Business of Fashion and McKinsey & Company).
- Personalization is becoming a greater and greater priority for fashion consumers, making investment in this area essential for fashion industry marketers (The Business of Fashion and McKinsey & Company).
- Ultimately, all the content creation needs to lead to sales, and social commerce is growing fast. By 2023, it could account for a fifth of all online sales in China — a staggering $166 billion (McKinsey & Company).
Employment Statistics

Are you interested in joining the 161 million individuals who work in the fashion industry? Explore the following employment statistics to get a look into average salary wages, unemployment rates and job opportunities in the clothing industry.
- In the United States, an estimated 1.8 million people are employed in the fashion industry, among whom 232,000 in manufacturing textiles for apparel and other fashion items (Joint Economic Committee).
- As of 2021, 30,539 people are working within the U.S. Fashion Designers industry (IBISWorld).
- Between 1990 and 2011, employment in the apparel manufacturing industry fell by over 80% (from approximately 900,000 to 150,000 jobs), largely due to technological developments such as automation (U.S. Bureau of Labor Statistics).
- 30% of fashion industry employees view their company’s post-crisis recovery planning as ineffective (McKinsey & Company).
- In 2018, 56% of worldwide fashion companies failed to make enough money to cover their capital costs (McKinsey & Company).
- Over 60% of consumers claimed to cut their fashion spending during the pandemic, with about half of those consumers believing this trend will hold true post-pandemic (McKinsey & Company).
- The 2020 average annual wage of all occupations within U.S. clothing stores was $32,670 with the lowest earners making $23,410 and the highest earners making $143,000 (U.S. Bureau of Labor Statistics).
Footwear and Apparel Stats
Per order, consumers paid up to 100 U.S. dollars when purchasing footwear, clothing or accessories in 2017. As the digital age has made shopping a faster and more customized experience, let’s take a look at how specific apparel items like footwear and accessories are performing in the industry today.
- By 2026, the global footwear sole material market is projected to value $28.2 billion with a 4.6 percent CAGR between 2021 and 2026 (Research and Markets).
- In 2020, the U.S. slipper market grew by approximately 50%, revealing that consumers are continuing to prioritize comfort over fashion (NPD).
- The global footwear market size reached $365.5 billion in 2020 and is projected to grow to $530.3 billion by 2027 with a 2020-2027 CAGR of 5.5 percent (Allied Market Research).
- The athletic segment would witness the fastest growth, registering a CAGR of 6.3% during the forecast (Allied Market Research).
- The global footwear market size is estimated to reach $530.4 billion by the end of 2027 (Allied Market Research).
- Smart footwear is the latest footwear market trend (Allied Market Research).
- China and India are emerging markets in this market. China is expected to grow with a CAGR of 8 percent while India is expected to exhibit a 7.3 percent growth rate during the forecast period (Allied Market Research).
- The athletic footwear US market alone generated around 19.6 billion dollars in 2017 (Revuze).
- Revenue in the Bags & Accessories segment is projected to reach US$164,841m in 2021 (Statista).
- Revenue is expected to show an annual growth rate (CAGR 2021-2025) of 8.37 percent, resulting in a projected market volume of US$227,384m by 2025 (Statista).
- In global comparison, most revenue will be generated in China (US$86,153m in 2021) (Statista).
- The Footwear market’s average volume per person in 2021 is projected to be 5.62, meaning on average, each person in the U.S. is expected to purchase 5.62 pairs of footwear by the end of 2021 (Statista).
- In 2019, worldwide retail sales for the apparel and footwear market hit $1.9 trillion USD and were projected to reach over $3 trillion USD by 2030 (Statista).
- In 2019, the size of the footwear and apparel market in the United States was estimated to be approximately 368 billion U.S. dollars (Statista).
Jewelry & Luxury Fashion Industry Statistics

The clothing industry is about ten times the size of the jewelry industry as measured in annual sales, but the average deal value in apparel is almost 20 times that in jewelry. Read these and other jewelry and luxury fashion industry statistics below to see how designer and luxury goods are standing out in a crowded industry.
- Online channels account for just 13% of luxury brand sales (Forrester).
- The global luxury market reached $1 trillion USD in 2018 and is projected to surpass $1.5 trillion by 2025 (BCG & Altagamma).
- Millennials represent approximately 32% of the luxury market and are largely responsible for the market’s growth. They are expected to comprise 50% of the market by 2025 (Matter of Form).
- China is a global leader in the luxury market, comprising 33% of it and projected to rise to 40% by 2025, making it responsible for 75% of the market’s growth between 2018-2025 (Matter of Form).
- 67% of Gen Z and 60% of millennial luxury purchases have bought a designer collaboration piece or special edition (Matter of Form).
- The jewelry industry’s annual global sales – amounting to €148 billion in 2014 – were projected to grow at an annual rate of 5 to 6 percent, amounting to €250 billion by 2020 (McKinsey & Company).
- Branded items already account for 60 percent of sales in the watch market (McKinsey & Company).
- Approximately 67% of luxury shoppers say they conduct online research before making in-store purchases, with one- to two-thirds citing social media as a common source of information (McKinsey & Company).
Sustainability Fashion Industry Statistics
As a third of Generation Z in the US are saying they will pay for sustainability compared to around one in 10 baby boomers, executives are taking note that there is an increasing demand for sustainably sourced products from their younger generation of consumers. Read how countries and brands alike are shifting budgets and efforts to support this wave for environmentally conscious fashion in our sustainability fashion industry statistics.
- The EU is set to offer $23.5 million of funding to support sustainable bio-based textiles and circular business models (European Commission).
- 45% of apparel companies are looking to integrate more innovative bio-based materials (McKinsey & Company).
- Sustainable swimwear is a fast-growing category: searches were up 65% year-on-year from February 2019 to February 2020. Eco-friendly swimsuits were in particularly high demand in Australia as well as the UK and the US (Lyst).
- 67% of sourcing executives state that the use of innovative sustainable materials will be important for their company (The Business of Fashion and McKinsey & Company).
- Denmark saw the biggest year-on-year growth in sustainable apparel searches from February 2019 to February 2020, with the greatest number of searches coming from Copenhagen (Lyst).
- Since searches for “vegan leather” increased by 69% while searches for “faux leather” did not change year-on-year between February 2019 and February 2020, it can be inferred that customers respond more positively to the word “vegan” than to the word “faux" (Lyst).
- 79% of all consumers say that they include sustainable packaging in their purchasing decisions (McKinsey & Company).
- In contrast with European shoppers, who tend to search for “sustainable fashion,” Australian shoppers prefer to use the phrase “ethical fashion.” Between December 2019 and February 2020, online searches for “ethical” fashion pieces increased by approximately 67% (Lyst).
- Moscow generated the greatest number of searches for sustainable fashion between February 2019 and February 2020 (Lyst).
- Between December 2019 and February 2020, searches for “upcycled fashion” grew by 42% (Lyst).
Fashion Industry Stats: FAQ

Explore some of the most frequently asked questions regarding the fashion industry below!
Q: What percentage of clothes are made in China?
A: In past years, China has accounted for as much as 40% of all clothing brought into the country. In April 2020, approximately 3.19 billion meters of clothing fabric was produced in China.
Q: What country buys the most clothing?
A: Although China as a country has the largest amount of purchases due to its large population, an average individual consumer in China spends just under a quarter of the amount than an average US consumer – and buys 23 fewer items per year.
Q: How much is the fashion industry worth?
A: Fashion is a highly sophisticated, $2.5 trillion global industry.
Q: Is the fashion industry growing? What is the fashion industry growth rate?
A: Yes, the fashion industry is growing. The fashion industry has an expected annual growth rate of around 7.3 percent between 2021 and 2025.
Now that you’ve caught a glimpse into the factors that are shaping what’s next in retail, share these fashion industry statistics with those who might be interested in the business of fashion.
From underwear to footwear, companies are changing their strategies to reach consumers every day. Stay in the know on all things retail with our extensive resources. For more resources on apparel, check out our study on underwear hygiene and eco-friendly ways to clean clothing.

Getting comfy for quarantine? Here are 3 must-have loungewear pieces